

Sign up for our Newsletter


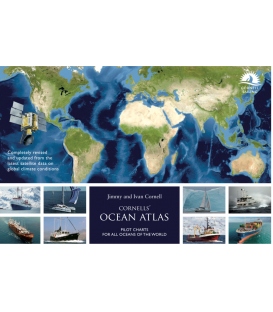
Cornells' Ocean Atlas: Pilot Charts for All Oceans of the World, 3rd Edition, 2023
Cornells' Ocean Atlas is:
- The first significant innovation in pilot charts — an essential tool for passage planning — since pilot charts were developed by Lieutenant Maury of the US Navy in the mid-1800s.
- The first and only pilot charts to be based on extensive near real-time geospatial and remote buoy sensing data from 1987 to the present measuring true surface wind and current – gathered from a network of OSCAR and other meteorological satellites, using NOAA and Earth and Space Research (ESR) data programs
- An integral part of Jimmy Cornell’s World Cruising Series – works hand-in-hand with World Voyage Planner, World Cruising Routes and World Cruising Destinations
60 monthly up-to-date pilot charts of all oceans of the world show:
- current rates and direction
- wind speed and direction
- approximate extent of the Intertropical Convergence Zone, commonly known as thedoldrums
- the most common tracks of tropical storms
- and the mean location of high pressure cells for each hemisphere
Canary Islands and New York to the Lesser Antilles (Caribbean)69 detailed charts of the most common transoceanic routes including:
- Lesser Antilles (Caribbean) to New York and Azores
- Lesser Antilles (Caribbean) and California to Galapagos
- Pacific Northwest and California to Lesser Antilles (Caribbean)
- Pacific Northwest to Galapagos and Marquesas
- California to Hawaii and Alaska
- Panama to Marquesas and Hawaii
- Australia and New Zealand to Tahiti and Fiji
- Tonga to New Zealand and the Torres Strait
- Seychelles to South Africa
- South Africa to North East Brazil
- Plus expanded detail for the Caribbean Sea, Mediterranean, Baltic Sea
Comprehensive description of weather conditions in every ocean.
Sidebars with tactical suggestions have been added to the months when most passages are undertaken.
Comments and tips on tactics, as well as weather overviews for each ocean, were contributed by meteorologists and routers specializing in those oceanic areas, such as Lee Chesneau, Peter Gibbs (BBC), Herb Hilgenberg, Bob McDavitt (New Zealand Met Office) and John Neal.
From Jimmy Cornell:
“The main objective of Cornells' Ocean Atlas is to make it possible to take advantage of prevailing winds and seek out whenever possible favourable conditions. Essentially, to try to always be in the right place at the right time, or, better still: Not to be in the wrong place at the wrong time!”
-
Pilot charts have been the most important passage planning tools since the middle of the nineteenth century. In spite of all the advances in electronics and aids to navigation, any prudent navigator planning a longer voyage should continue to refer to pilot charts as valuable sources of information on weather conditions, tropical storm seasons and critical areas, as well as prevailing winds and currents.
In the 12 years since the first edition of this atlas was published there has been a marked intensification of the effects of global warming on weather conditions throughout the world. In this fully revised and updated edition the main focus is on all changes that may affect offshore voyages.
One of the most noticeable phenomenon is the decrease in the regularity and reliability of trade winds, as witnessed by sailors on some of the frequently travelled ocean routes. However, the most significant and visible change has been the increased intensity and extent of tropical cyclones, both in the duration of the critical seasons and the areas affected. As this phenomenon has such a major impact on voyage planning, and safety generally, in order to provide a full perspective on the current situation, this new edition contains all relevant facts for every area of the world that is affected by tropical cyclones.
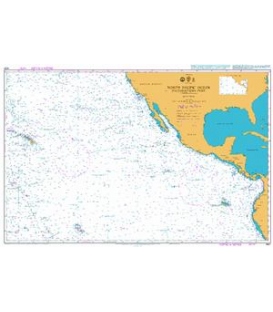
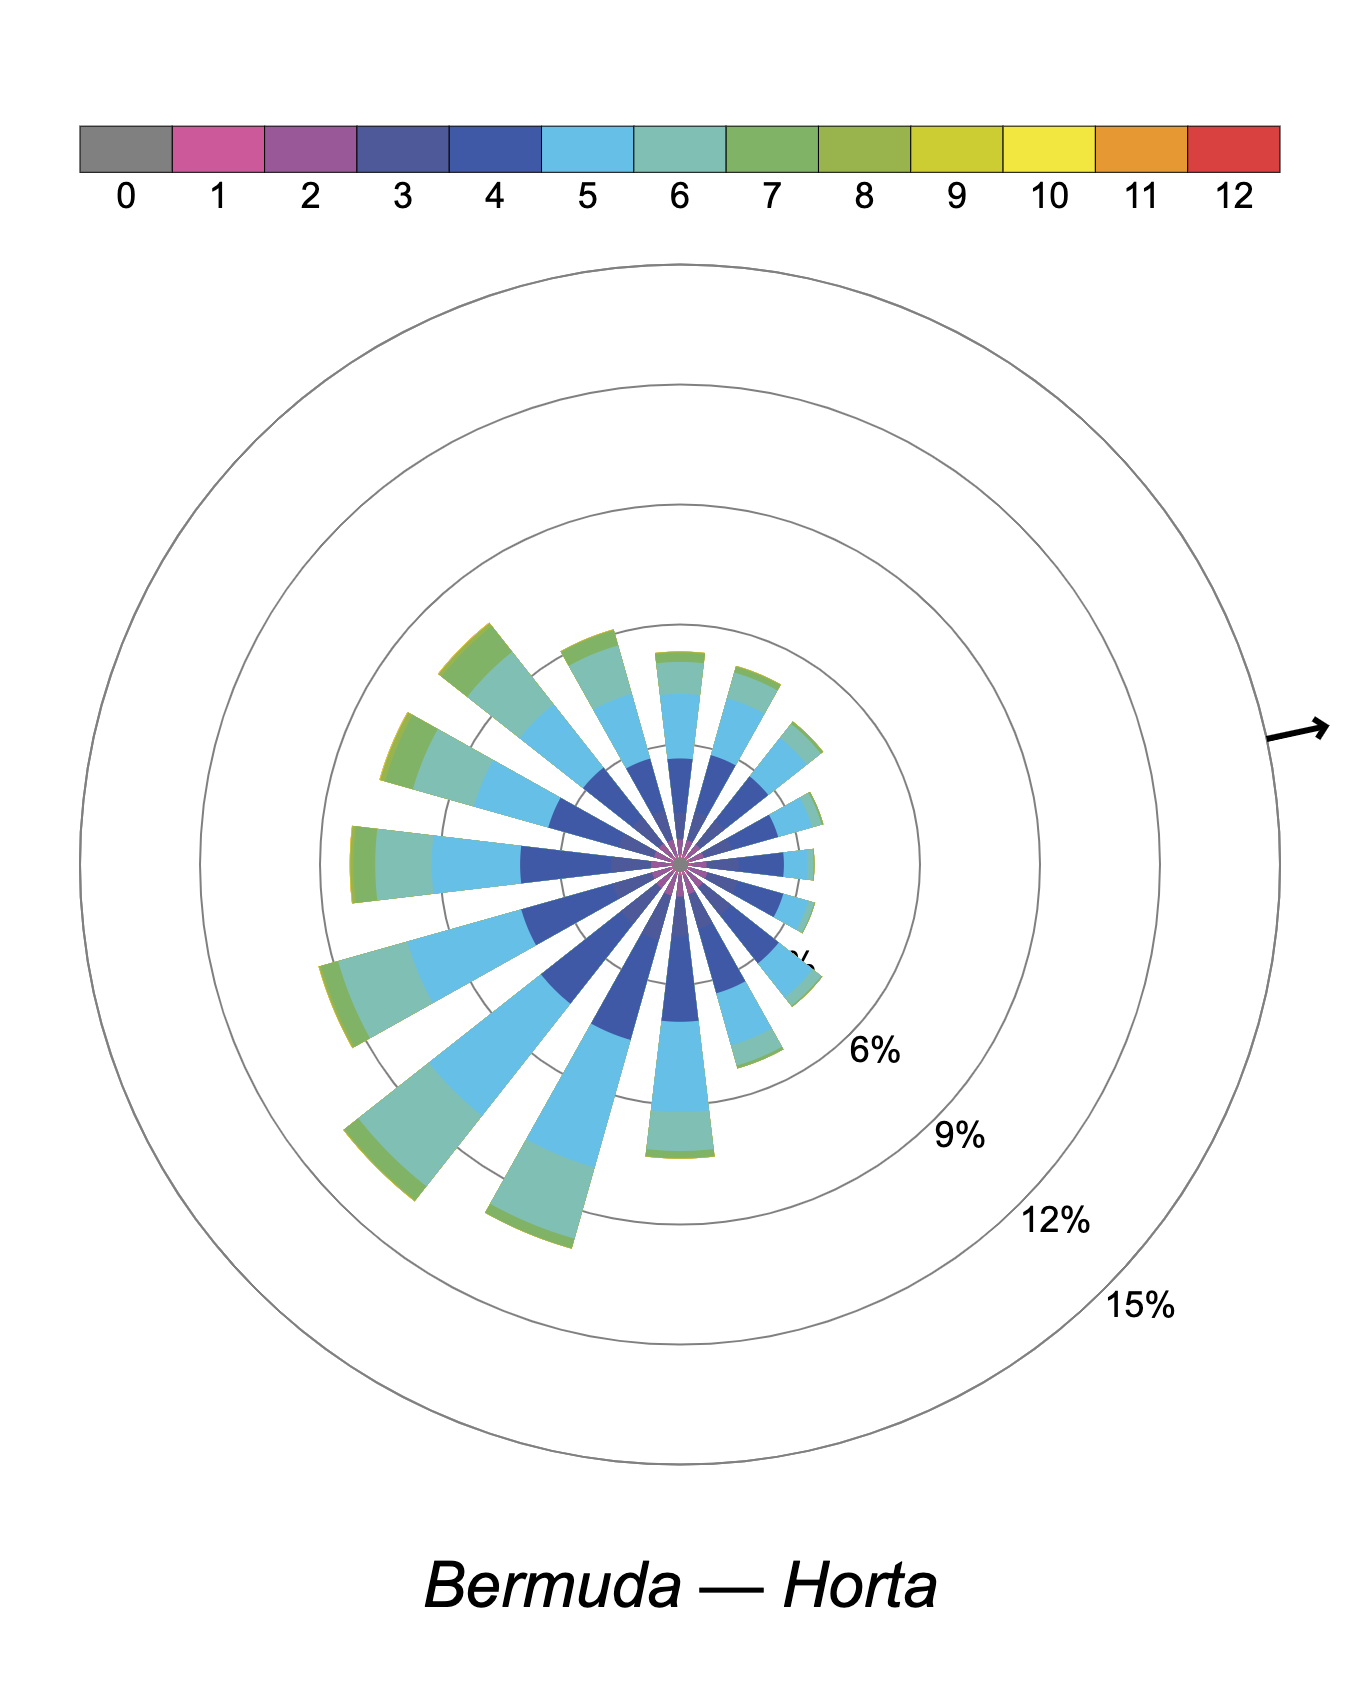
To present an accurate picture of the actual weather conditions that prevail in the world’s oceans, the pilot charts featured in this atlas are based on the data collected by a network of meteorological satellites, augmented by observations obtained from meteorological buoys and other sources, during the last twenty-five years. The most detailed information is displayed in windroses, with every single windrose being based on a total of 218,000 samples of data.

The windrose arrows fly with the wind and the length of each arrow shows the percentage of the total number of observations in which the wind has blown from that cardinal point. The number of feathers shows the force of the wind, which has been recorded most frequently from that sector. The wind force is measured on the Beaufort scale, with each feather being equivalent to one unit of wind force, so that four feathers represent average force 4 winds from that direction for that month. In areas with prevailing winds, the resulting arrow would be too long to be shown in its entirety, in which case for percentages higher than 25, the percentage is shown numerically on the shaft. The figure in the centre of each windrose gives either the percentage of calms in blue (less than force 2), or the percentage of storms in red (more than force 7), whichever is greater.
Ocean currents are shown as green arrows indicating their prevailing direction and rate in knots. Variable currents are shown as a dotted arrow, its direction being determined by the highest percentage of currents recorded to set in that direction.
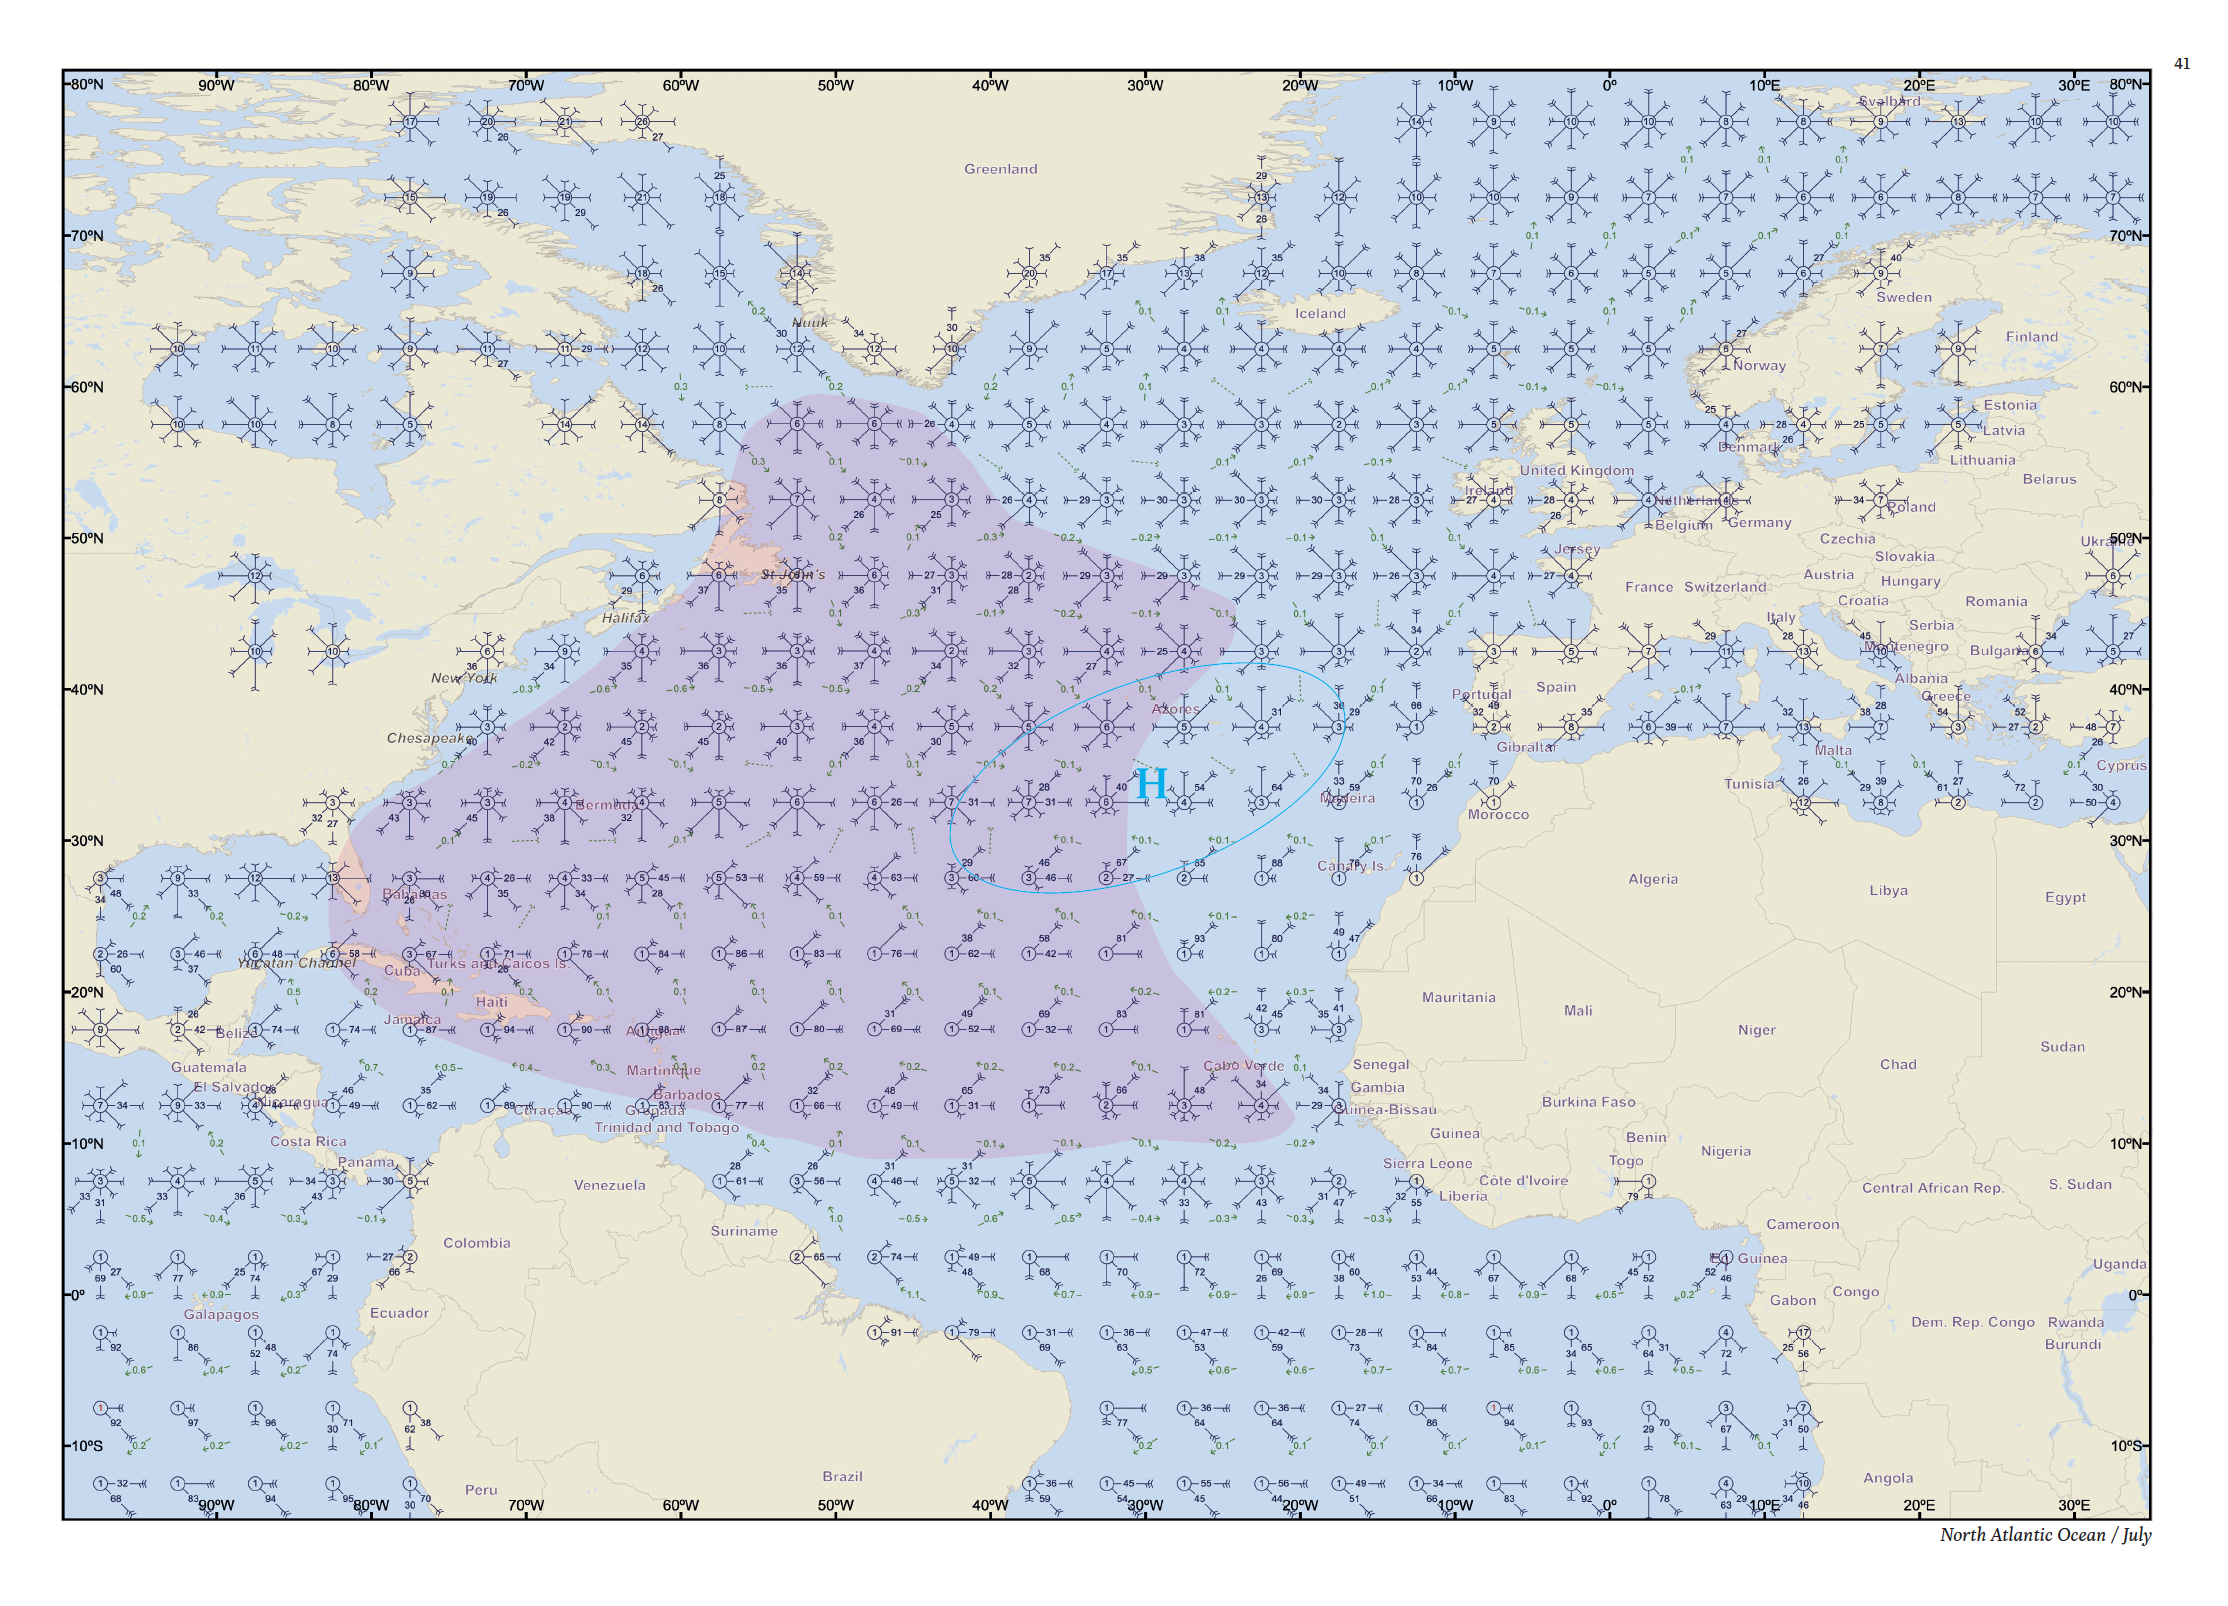
Hurricane area North Atlantic July
The extent of the ocean areas affected by tropical storms are highlighted on the monthly charts where they occur. The highlighted section only shows the area where the system had reached the intensity of a become a tropical cyclonic storm. The extent of those areas is based on the recorded tracks of such storms in recent years. This feature is a new addition to the current edition of the atlas and has been included to indicate clearly the areas that should be avoided during the critical seasons.
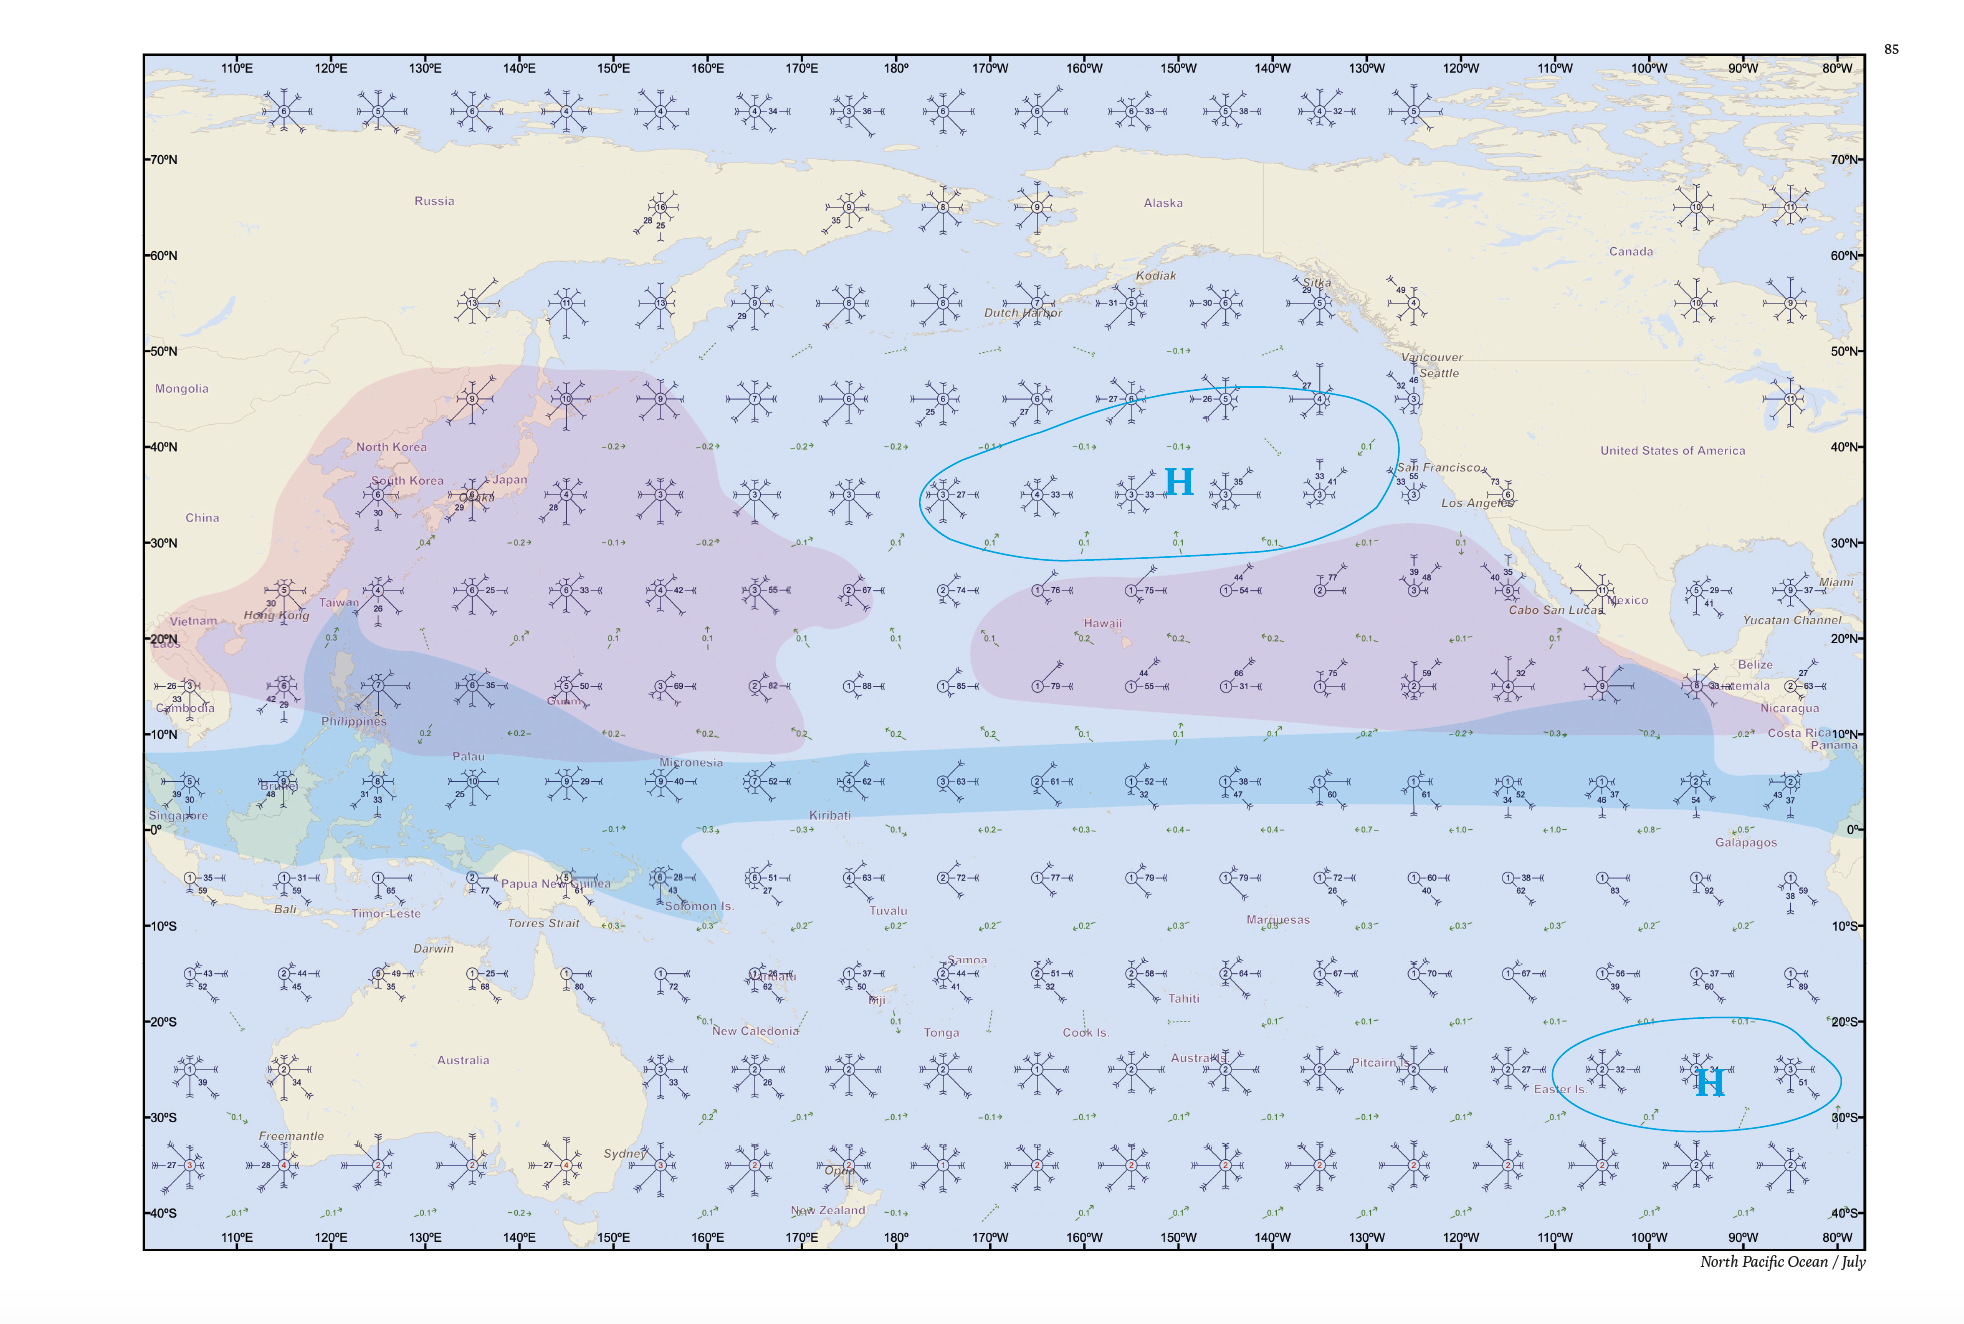
Cyclones areas North Pacific July
Also shown on each monthly chart are three phenomena of particular interest to offshore navigators: the approximate monthly extent of the Intertropical Convergence Zone, the areas affected by tropical storms during the critical months, and the mean location of high-pressure cells for each hemisphere and month of the year. The approximate location of the high-pressure cell is shown for each month.
Sidebars with tactical suggestions have been added to the months when most passages are undertaken in a specific area. Some of the comments and tips on tactics were contributed by meteorologists and weather routers specialising in those oceanic areas.
The safety factor in voyage planning is now even more important than in the past. With careful planning, and by being aware of the consequences of climate change, tropical storm seasons, and critical areas can still be avoided. Bearing in mind the changed circumstances, these are the basic safety measures that should be adhered to when planning a voyage now or in the near future.
Arriving in the tropics too close to the start of the cyclone-free season should be avoided, and a safe margin should be allowed by leaving a critical area before the end of the safe period.
- Cruising during the critical period in an area affected by tropical storms should be avoided. Those who plan to do so should monitor the weather carefully and make sure to be close to a place where shelter could be sought in an emergency.
Caution lies at the heart of voyage planning, and this atlas will make it possible to plan a safe voyage even in these changing times. For those who plan a voyage in the near future, this atlas will provide a useful tool in planning, preparing, and bringing a journey to a safe and happy conclusion.